
DAMPE Tools
IRFs
| Source: | Pubtime:2021-08-31 |
1. Effective Area
Effective area is a numerical function varying with energy of a gamma-ray photon and its incidence direction in the instrument reference frame. We divide the MC data into 20 energy bins from 1 GeV to 100 GeV (40 energy bins from 1 GeV to 10 TeV) and 10 angular bins from 0◦ to 60◦ for LET (HET) data. Figure 1 shows the effective area of DAMPE gamma-ray observations as a function of energy and incidence direction.
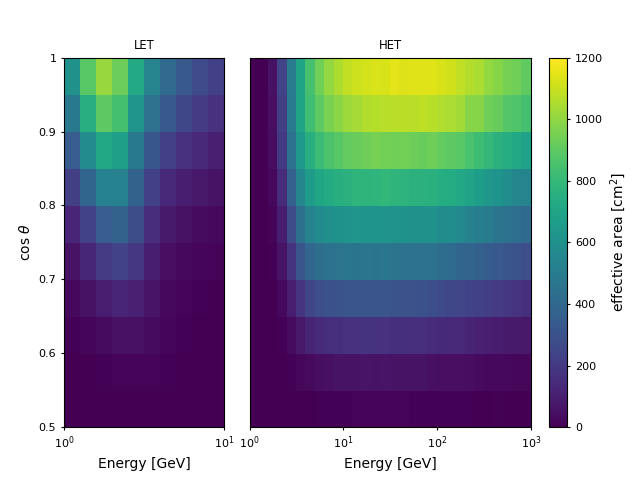
Figure. 1 The effective area of DAMPE (in units of cm2) for gamma-ray observation at different energies and incidence directions. The energy is in 20 bins from 1 GeV to 100 GeV for LET photons (left panel) and 40 bins to 10 TeV for HET photons (right panel). The incidence angle is in 10 bins from 0◦ to 60◦. Note that the effective area presented here is averaged over φ.
2. Point-spread Function
The reconstructed direction (v′) of the photon may deviate from its true value (v), and the probability distribution of the deviation δv = |v′−v| is parameterized by the Point-spread Function (PSF).
Based on the MC data, we construct a histogram of angular deviations of the selected gamma-rays for each energy and incidence angle bin and for each trigger types. the PSF histogram is fitted with a double King Function:
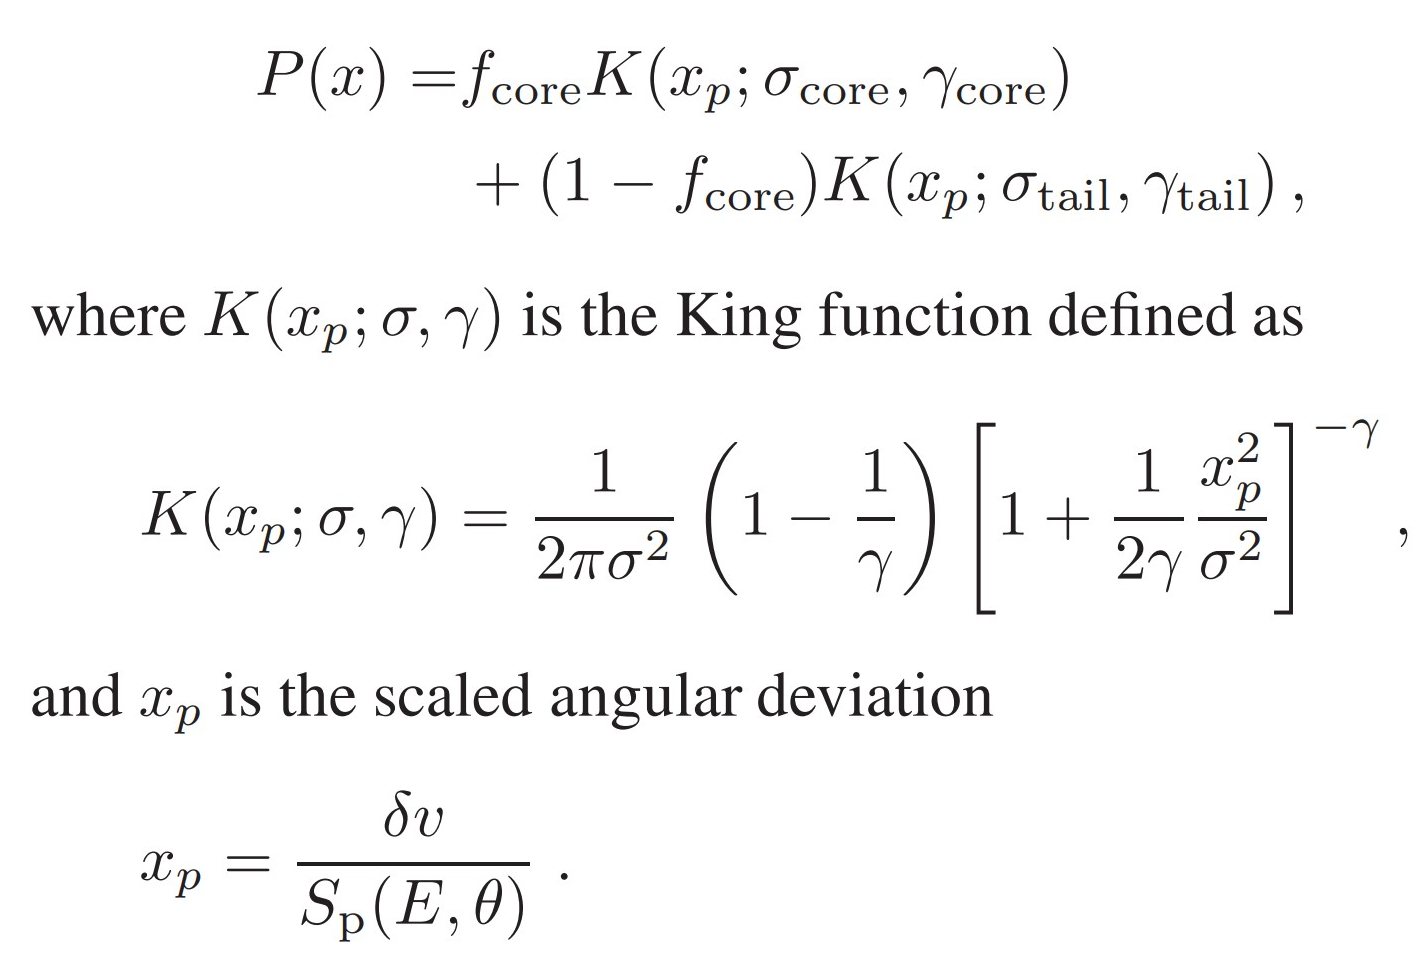
The Sp(E, θ) is the angular resolution (defined as 68% containment of the angular deviation) at energy E and incidence angle θ. We divide the MC data into four energy bins from 1 GeV to 100 GeV (eight energy bins from 1 GeV to 10 TeV) and five angular bins from 0◦ to 60◦ for LET (HET) data. Figure 2 displays an example of the best fit to the scaled angular deviation with the double King function in the bin of E ∈ [3.16, 10] GeV and θ ∈ [25.84◦ , 36.87◦] for HET photons.
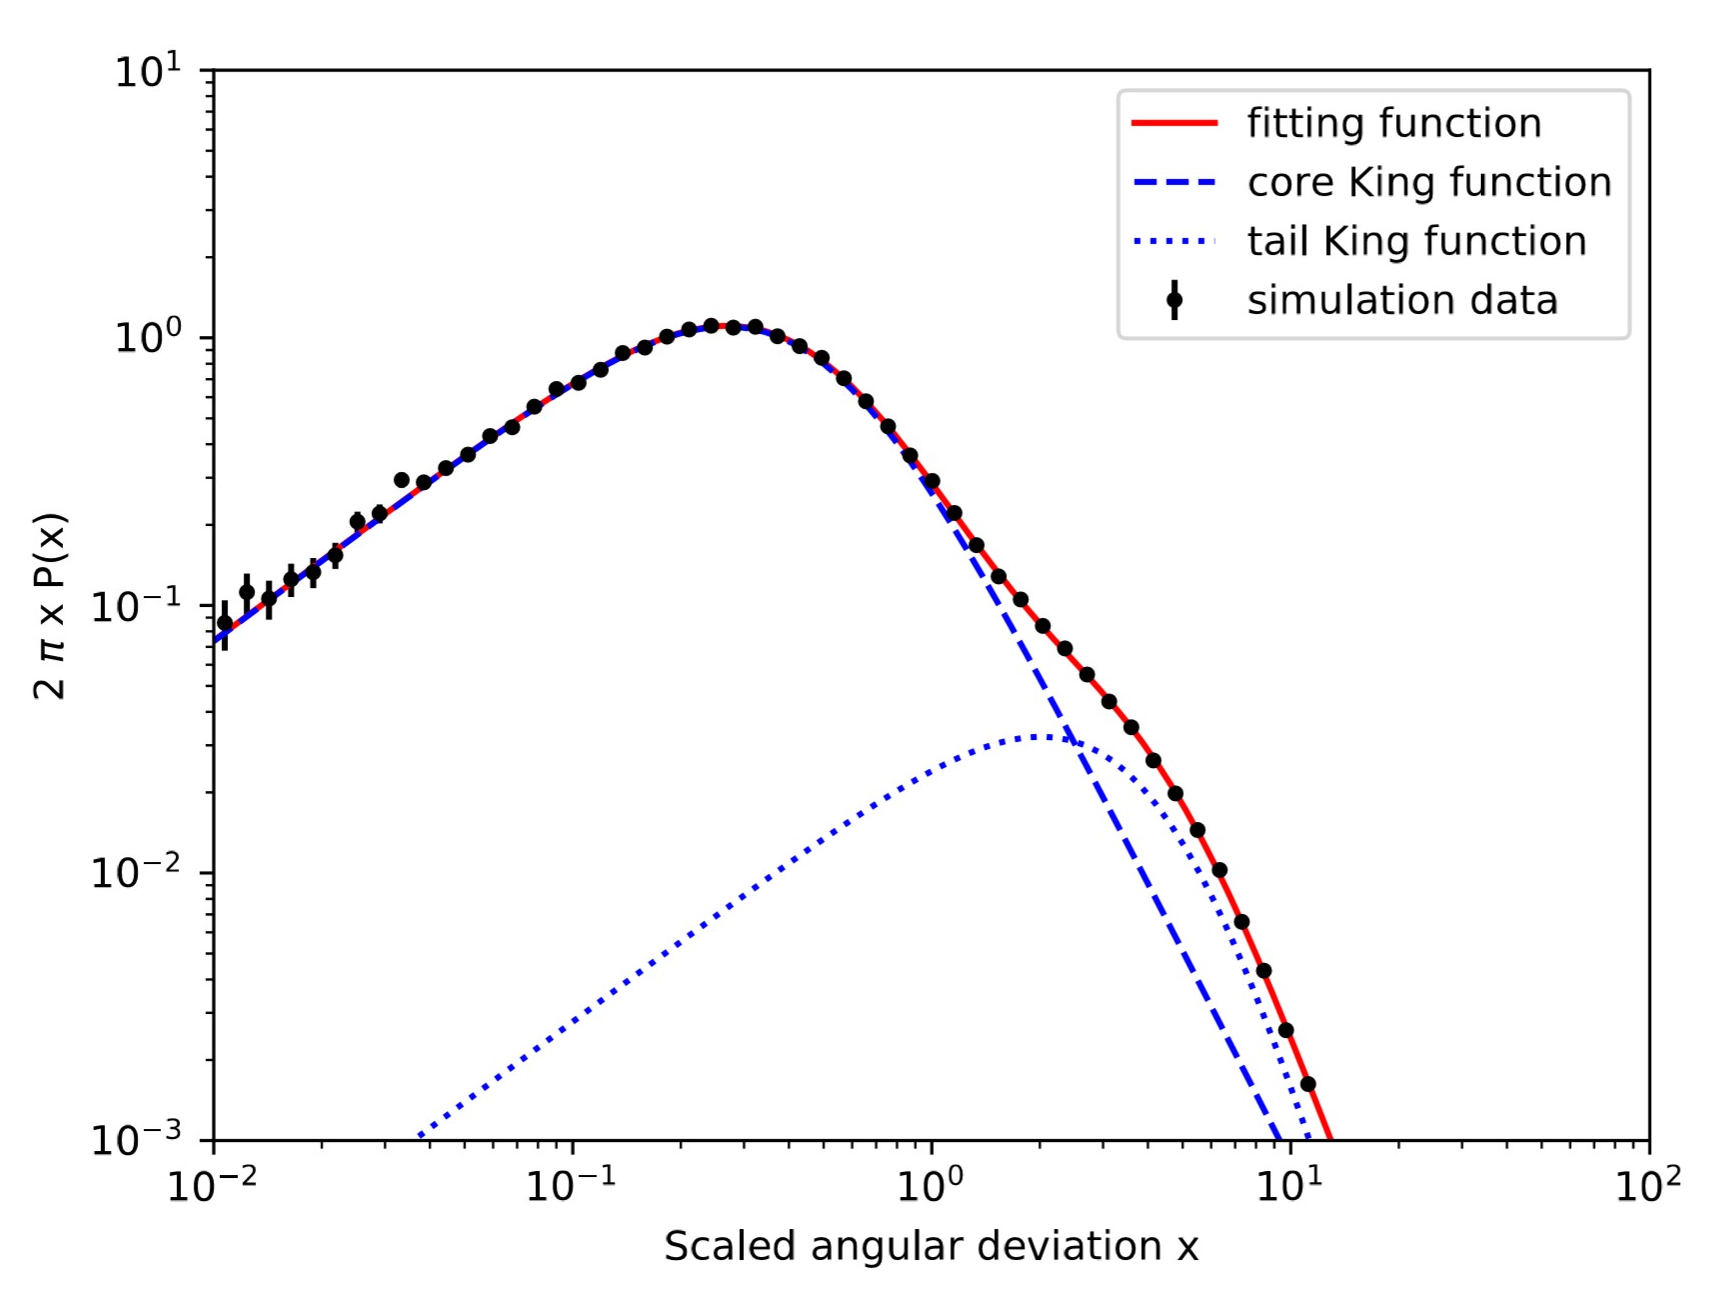
Figure. 2 The best fit to the scaled angular deviation with double King function in the energy range [3.16, 10] GeV and incidence angle range [25.84◦, 36.87◦] for HET photons. The points are the distribution of the scaled angular deviation for the MC data, the dashed and dotted lines are the core and tail King functions respectively and the solid line is the sum of the two components. The reduced χ2 of this fitting is 1.09.
3. Energy Dispersion
The energy dispersion function gives the probability of a photon with true energy (E) being allocated an energy (E′) after reconstruction of the events. We fit the MC data with three piecewise functions in the form.
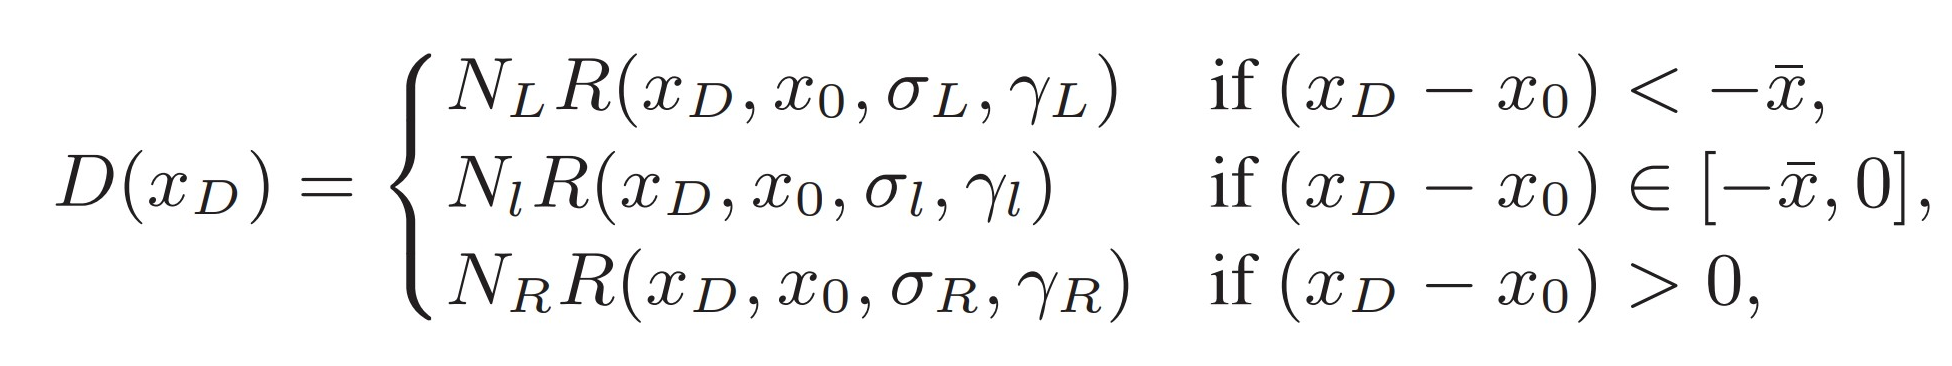
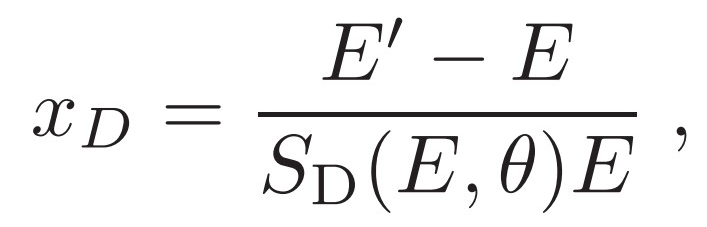
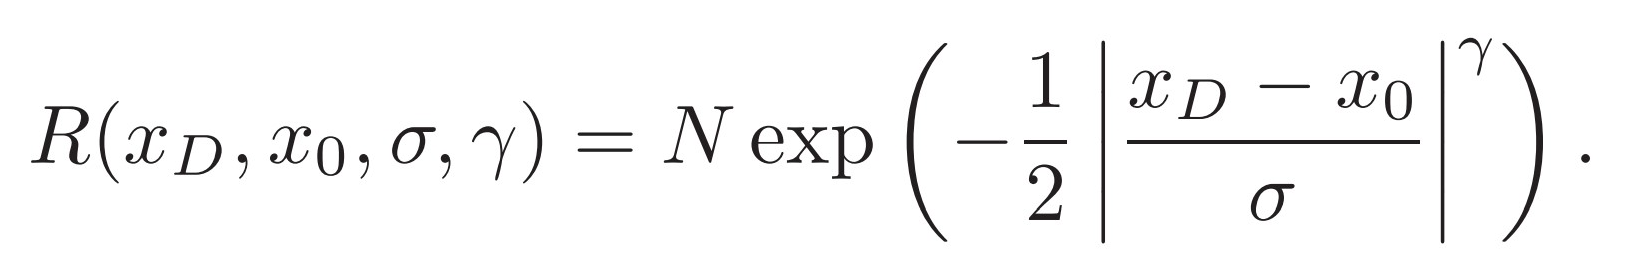
where the scale SD(E, θ) is the energy resolution (defined as the half-width of the 68% containment range of the energy deviation) at the bin center of energy E and incidence angle θ. We divided the MC data with the same binned method as the PSF. Figure 3 shows an example of energy dispersion fitted with the function in the bin of E ∈ [3.16, 10] GeV and θ ∈ [25.84◦, 36.87◦] for HET photons.
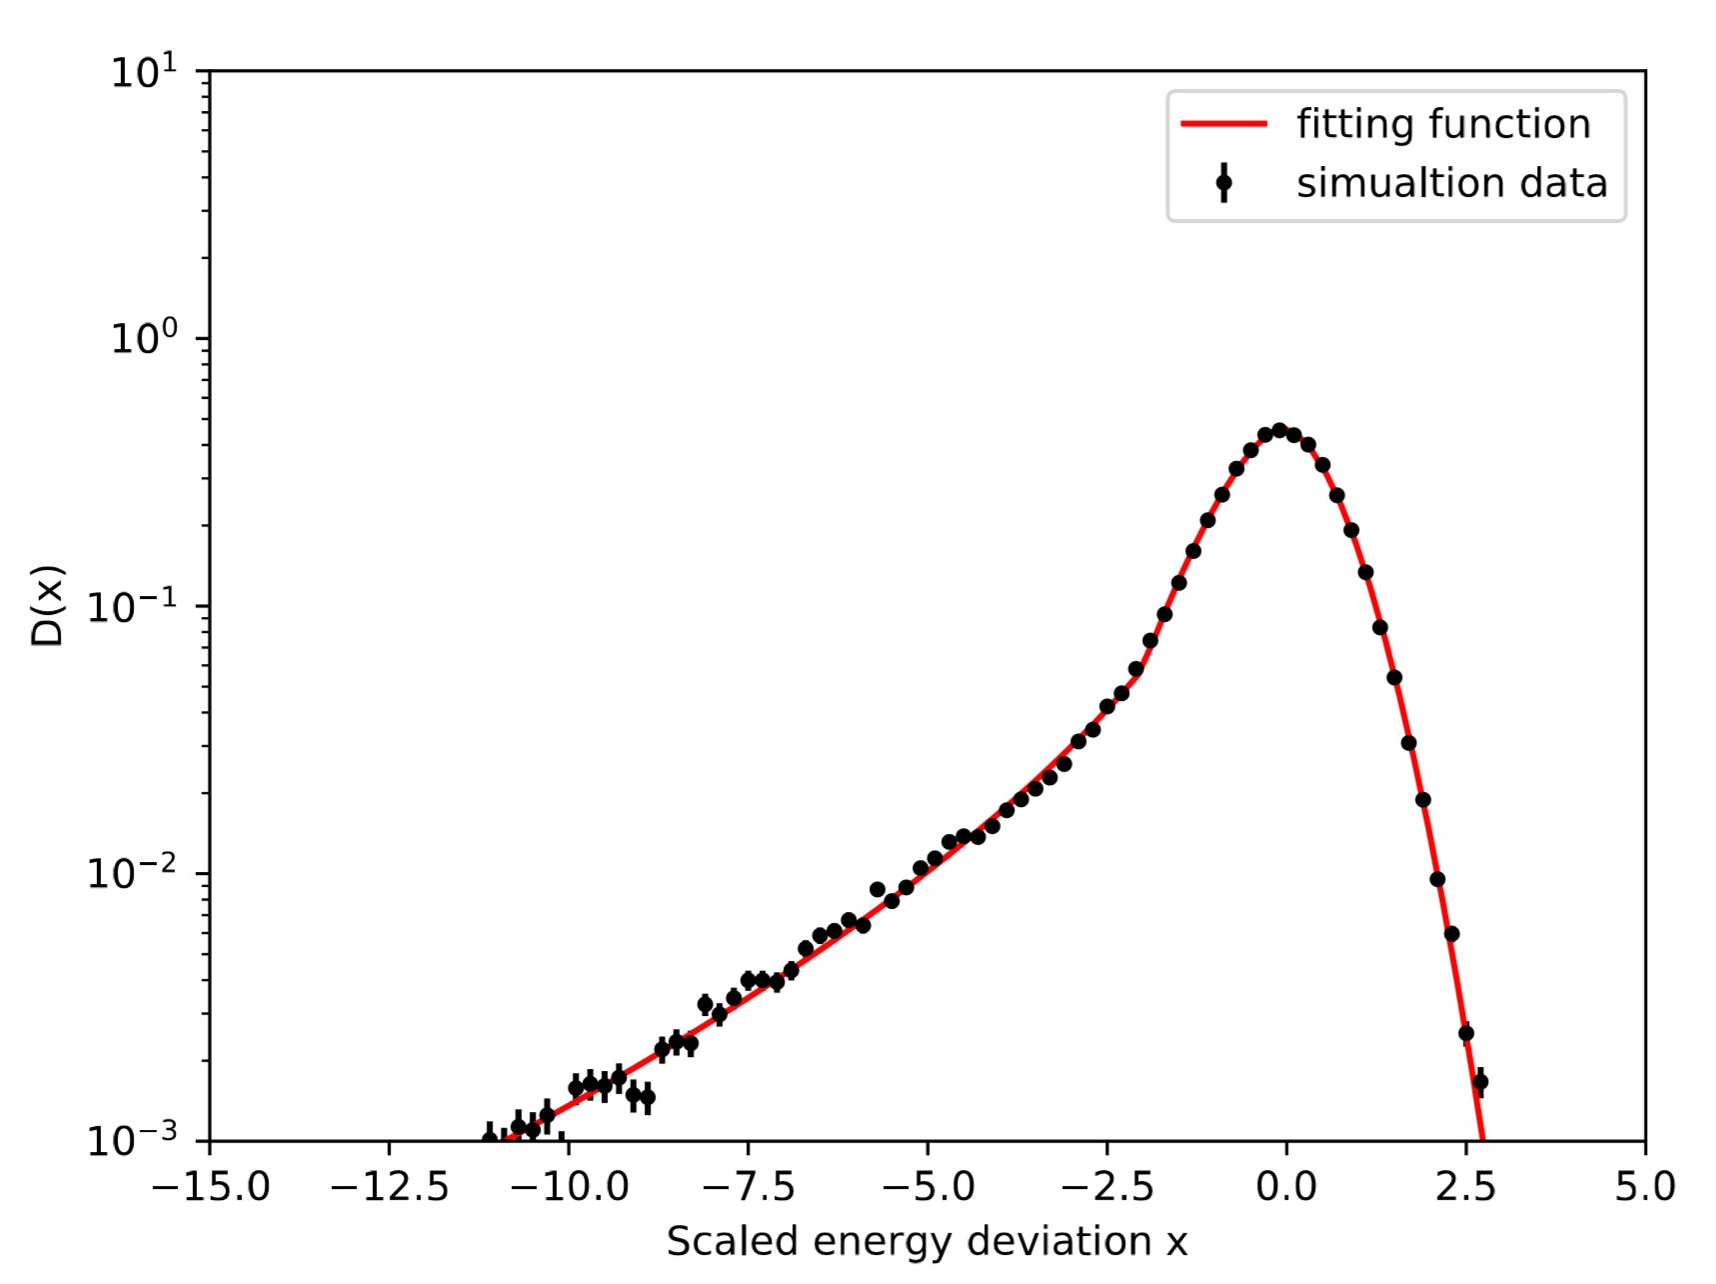
Figure. 3 The best fit to the scaled energy deviation with the energy dispersion function in the energy range [3.16, 10] GeV and incidence angle range [25.84◦, 36.87◦] for HET events. The points are the scaled deviation distribution of the MC data, and the line is the best fit function. The reduced χ2 of this fitting is 1.05.